Securian Financial Home

Secure Insights®

Optimize your plans with our proprietary tool

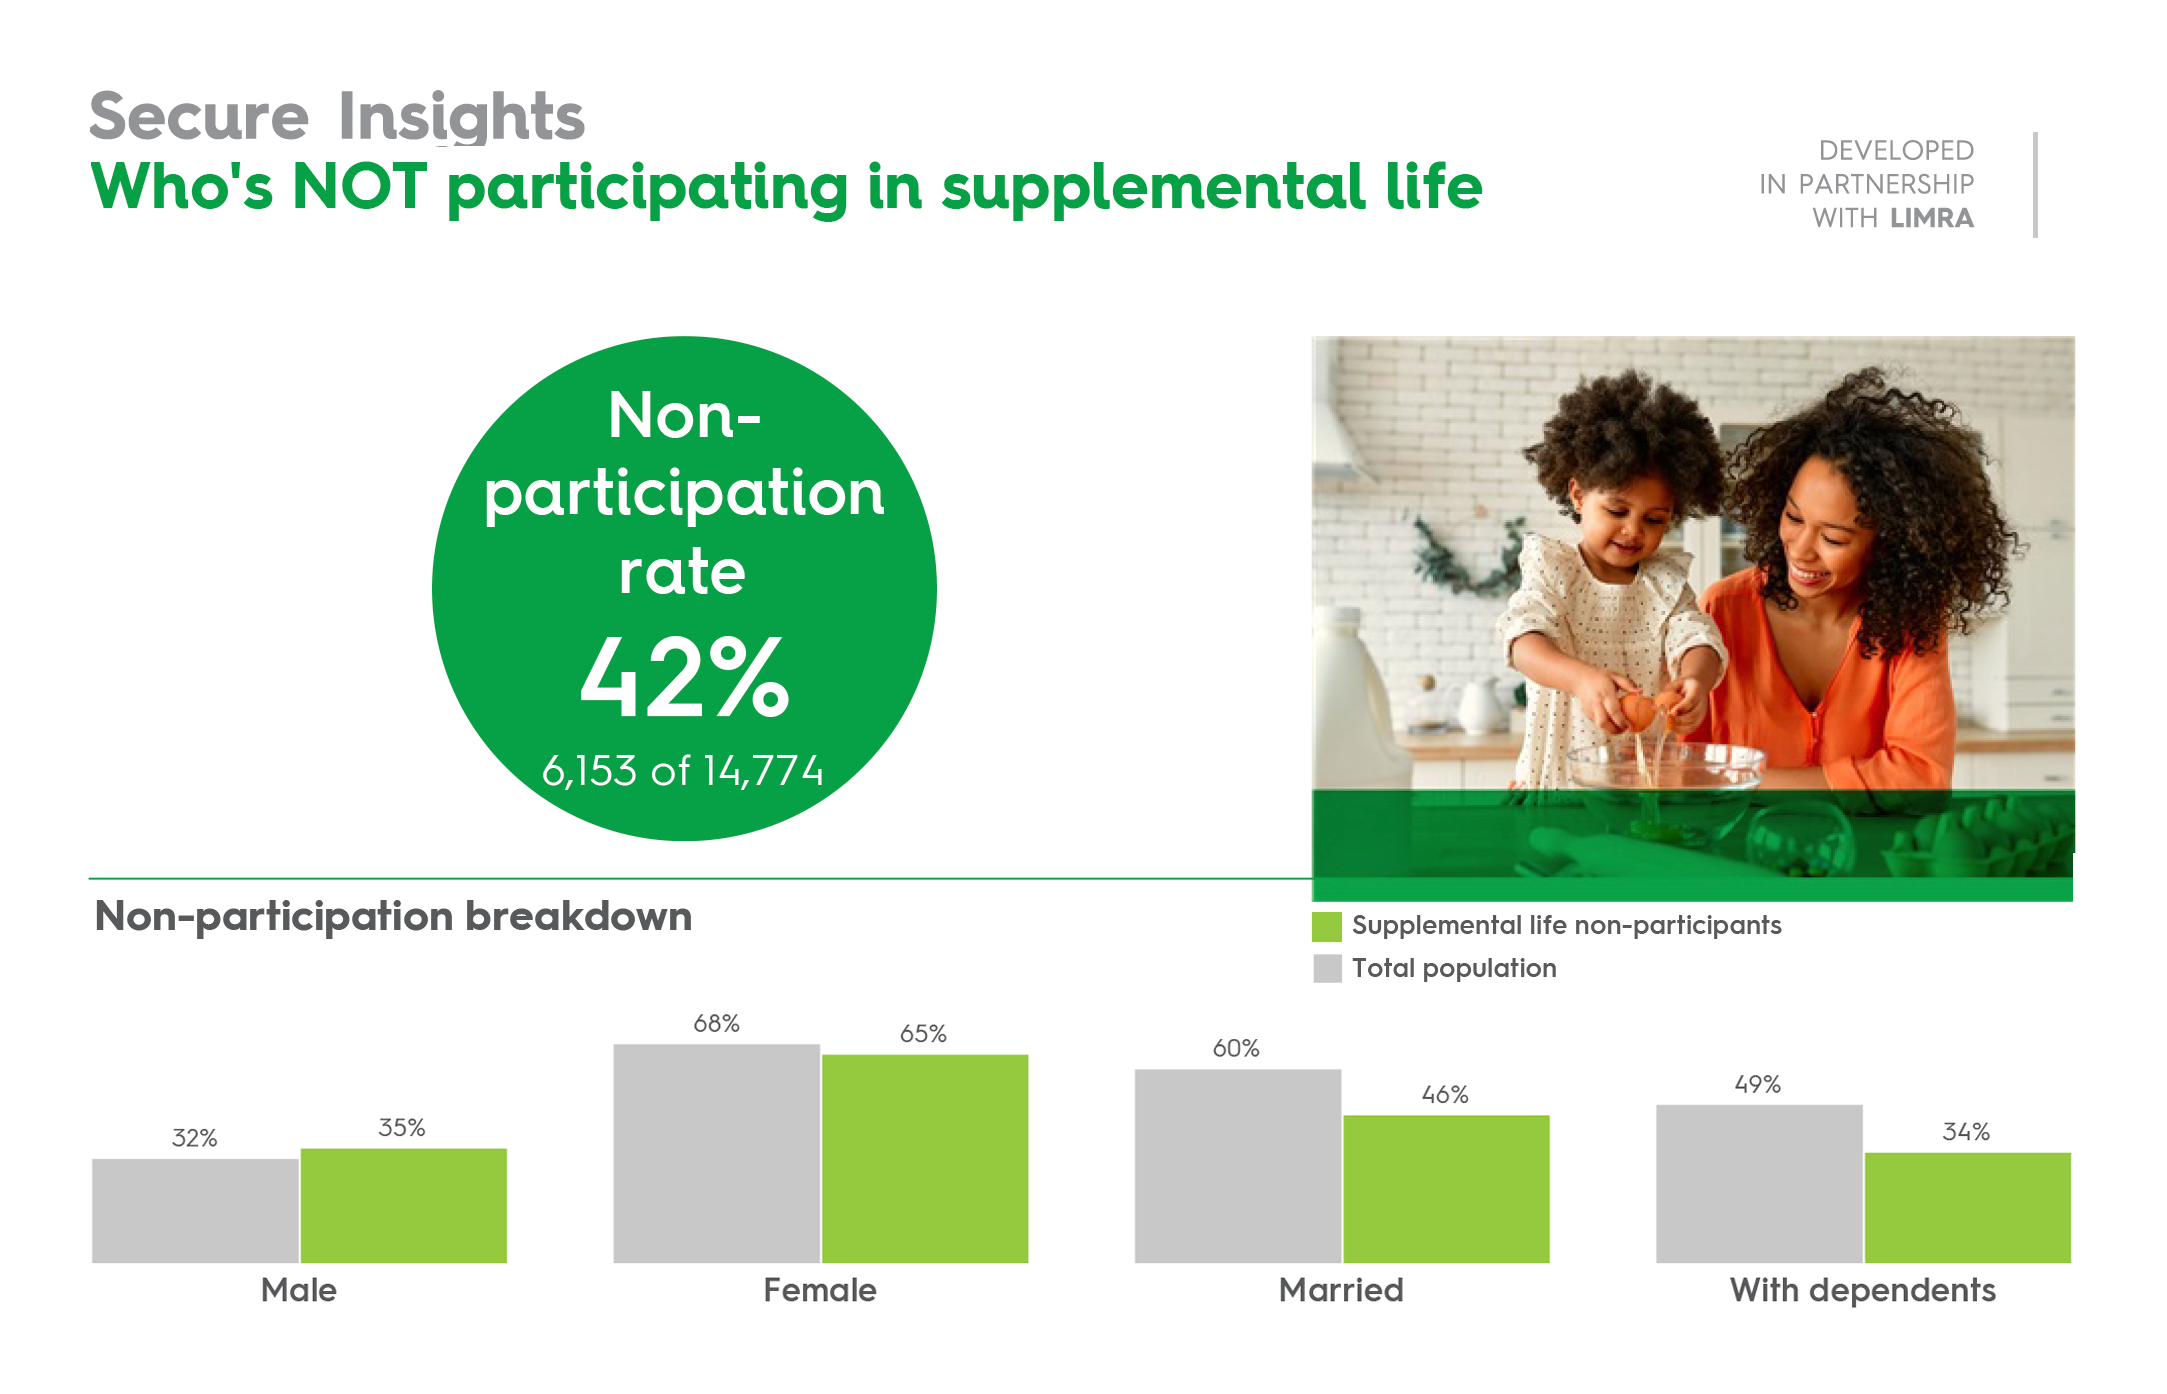
Secure Insights is our proprietary, multi-faceted data analytics solution developed in partnership with LIMRA for group insurance clients.

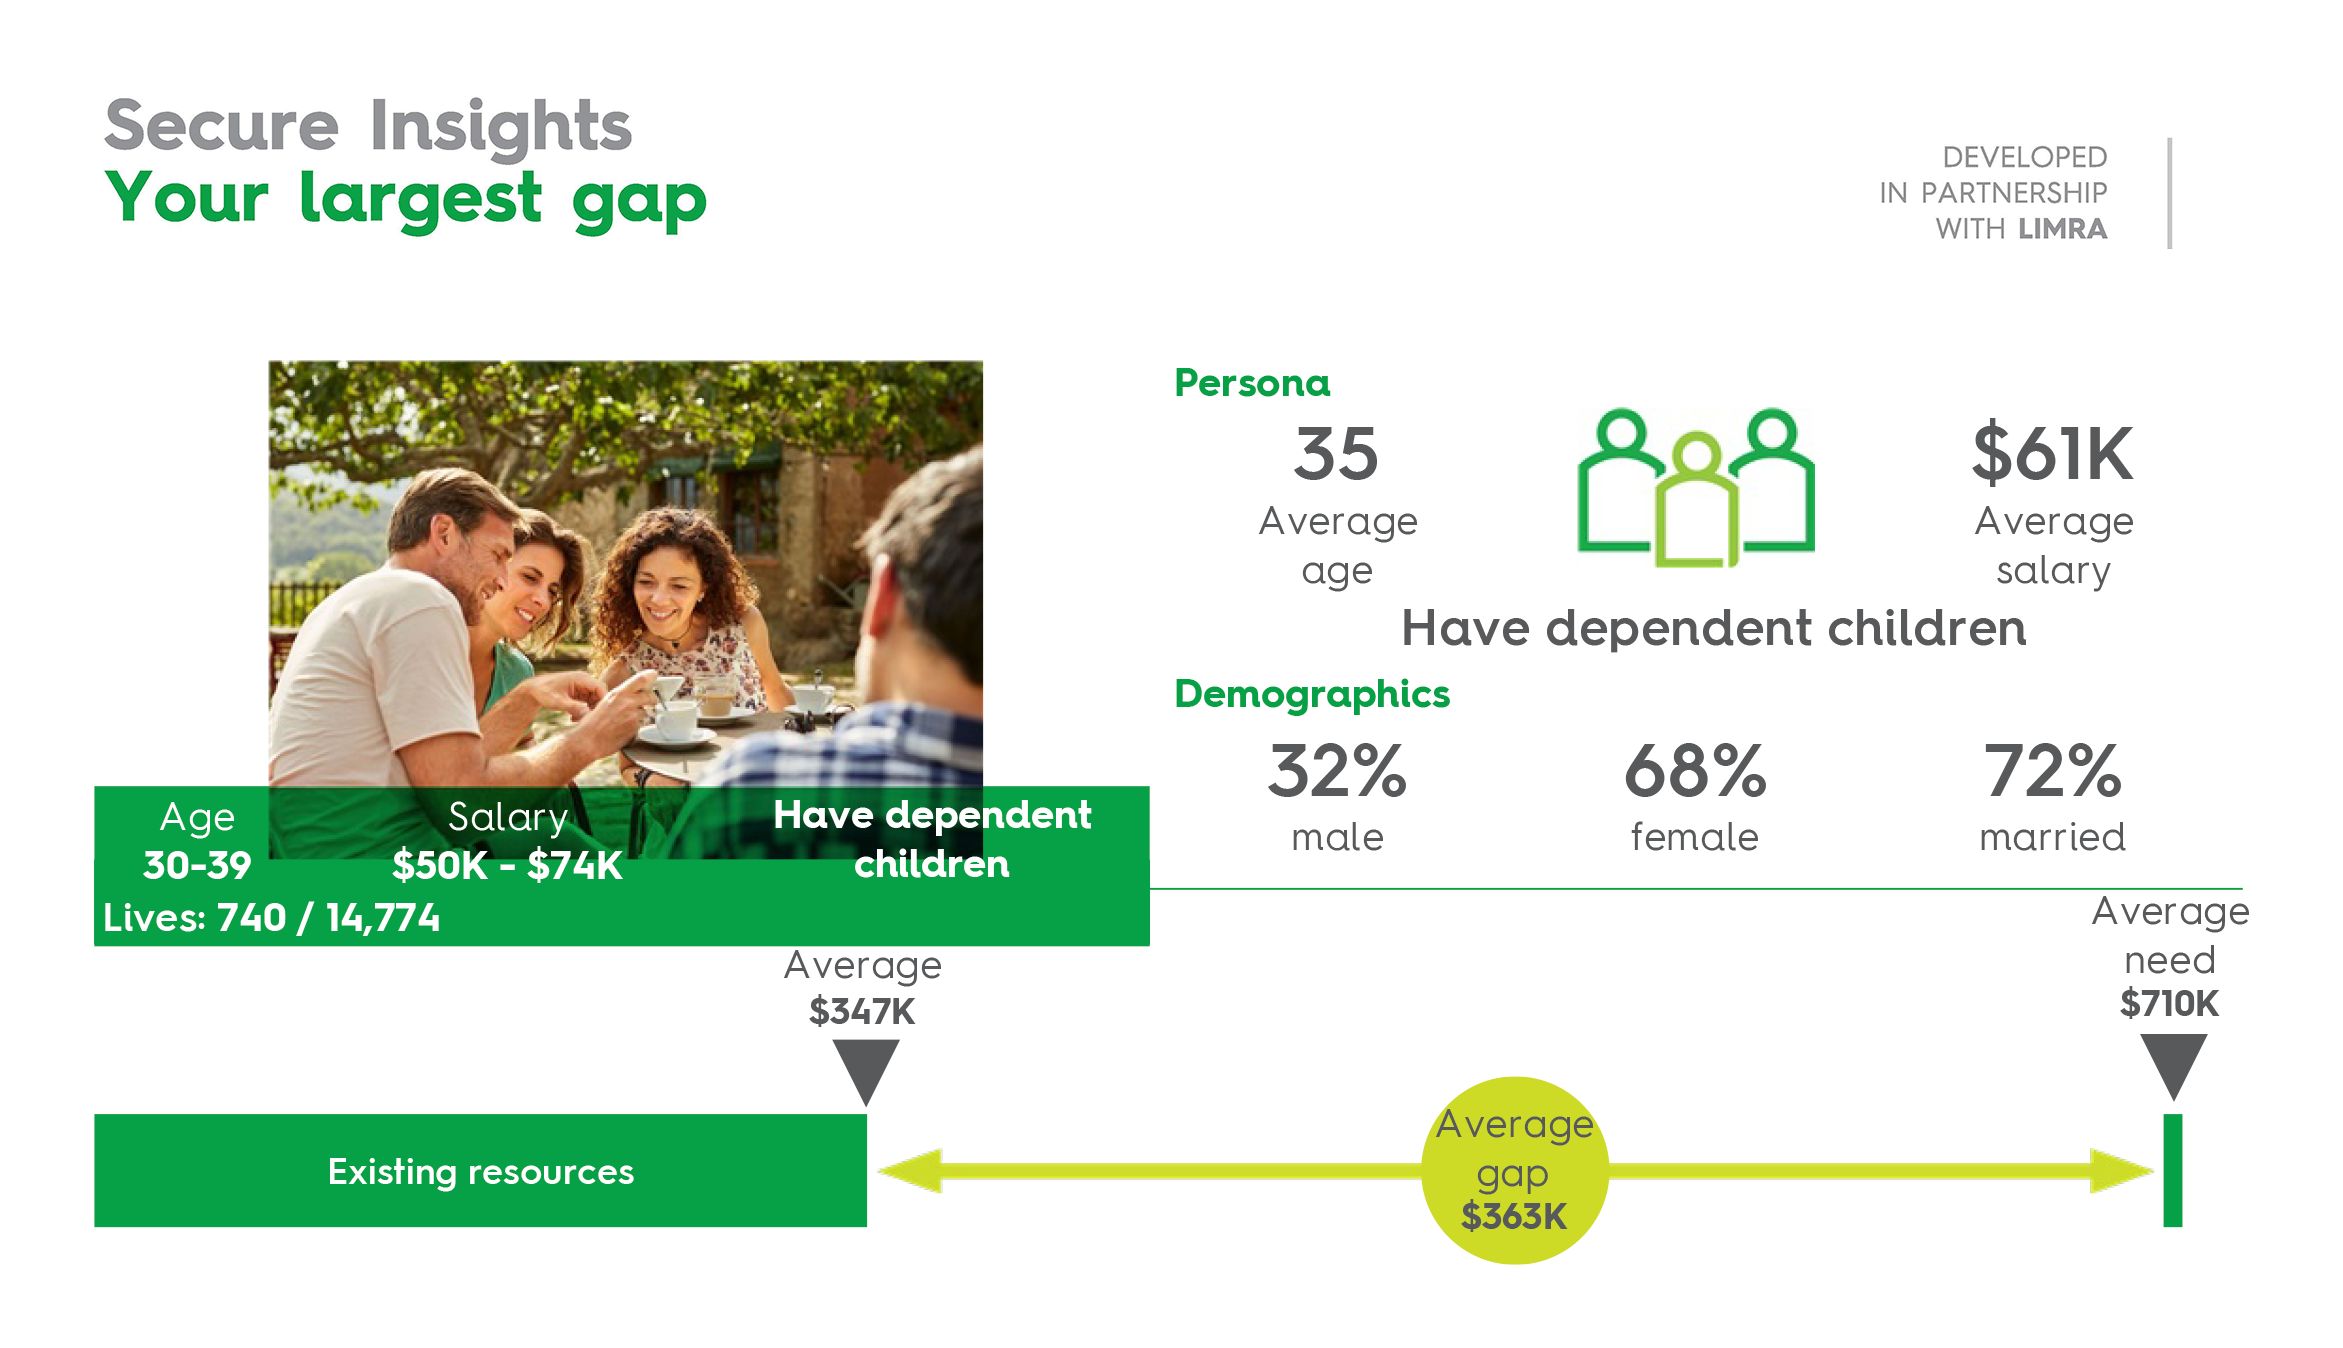
The tool leverages LIMRA industry data, third-party data and client census data to develop a report that provides employers a deeper understanding of their population, their populations’ needs, and the products and services we offer.

Secure Insights provides a holistic view to identify opportunities, set goals, make decisions and execute changes to help achieve the plan’s full potential.

Continue to innovate with enhanced reporting

New enhancements have been made to our Secure Insights report — which already evaluates employees’ readiness in the event of death — to show employees’ overall preparedness to financially protect themselves and their families in the event of an accident, critical illness or hospital stay. 

Certificate with seal of approval

Achieve your plan’s full potential

Our sales team can help you get started

Contact sales today

Key featured insights

The following information highlights life insurance and critical illness coverage within the report; however, we also create reports for our accident and hospital indemnity products.

Overall client score

The Secure Insights score represents how financially prepared employees are in the event of a death, accident, critical illness or hospital stay.

To reach the score, we subtract existing resources from the financial need and come up a gap amount.

The score is calculated for each individual on a client census, then aggregated to a combined, weighted average score.

View a life insurance sample page

A Secure Insights Score of 49 A gauge moves up from 0 to 49 to reveal the existing resources, indicated as good on the scale. Leaving a financial needs gap of 51 percent. EXISTING RESOURCES Secure Insights Score: 0 G O O D B E T T E R B E S T G A P FINANCIAL NEED

Average employee insurance needs

We chose common, simplified claim scenarios to assess need — in this case, the common medical event is a cancer diagnosis.

Medical costs such as deductibles and coinsurance are considered, as are non-medical costs associated with transportation, food and housing.

View a critical illness sample page

Based on the likelihood of an employee incurring medical expenses due to a cancer diagnosis

Health needs based on the likelihood of an employee incurring medical expenses due to a cancer diagnosis Chart showing the average insurance needs by family status. Employees with dependents have $13,866 average out-of-pocket medical expenses. Which consists of the deductible and coinsurance. This same group also shows an average non-medical expenses of $34,150. Compared to employees with dependents who have average out-of-pocket medical expenses of $6,668. Against $22,995 of average non-medical expenses. $35,000 $30,000 $25,000 $20,000 $15,000 $10,000 $5,000 $0 Employee with dependents $34,150 AVERAGE INSURANCE NEEDS FAMILY STATUS Employee without dependents $22,995 Average out-of-pocket medical expenses (deductible & coinsurances) Average non-medical expenses $13,866 $6,668

Insurance gaps

This insight shows the gaps at various age ranges across an employee population. 

In this case, 53% of the population would have a financial gap in the event of a death.  

The space between the average existing resources (vertical bars) and the average product need (horizontal lines) visually depicts the gap in the graph. On average, employees need an additional $109,321 in financial protection.

View a life insurance sample page

Based on employees' existing resources (financial adders and current coverage)

Employee existing resources Financial assets and current coverages EMPLOYEE EXISTING RESOURCES AGE RANGE 0K 100K 200K 300K 400K 500K (FINANCIAL ASSETS & CURRENT COVERAGE) <30 30-39 40-49 50-59 60-69 $201K $432K $459K $311K $152K Average need Average existing resources $146K $217K $315K $242K $130K

Population overview

Understanding employee population is key. The population overview represents the demographic breakdown of a client’s population that builds a foundation for the insights in the rest of the report.

Marital status, the presence of dependent children and salary are critical variables when calculating need — and therefore have a significant impact on the analysis.

View a sample page

Employee population marriage demographics A bar chart showing that 58 percent are married. 0 % are married

Employee population children demographics A bar chart showing that 47 percent have dependent children. 0 % have dependent children

*Based on census data as of 01/01/2020 and adjusted to reflect US population data for greater accuracy. This adjustment is applied to all spouse and/or dependent information throughout the report due to data quality of the census file.

Employee population gender demographics A pie chart showing that the split is 72 percent female and 28 percent male. 28 72 % % male female

Product enrollment

This insight highlights the enrollment in a plan — in this example, critical illness insurance.

It can help the client understand those enrolled by their family status and the level or dollar amount and shows the client-specific plan design.

View a critical illness sample page

Percent of enrolled employees by family status

Percent of enrolled employees by family status The bar chart shows the breakdown of plan elections for the 2,661 employees. The first bar shows 43.3% are employee only. The second bar shows 17% are employee and spouse. The third bar shows 10.5% are employee and child. And the final bar shows 29.2% are employee and family. 80% 70% 60% 50% 40% 30% 20% 10% 43.3%1,152 of 2,661 17.0%452 of 2,661 10.5%279 of 2,661 29.2%778 of 2,661 Employee Only Employee & Spouse Employee & Child Employee & Family PLAN ELECTION

Non-participant data

Secure Insights can also help you better understand who is not participating in employer plans.

This shows the demographics of non-participants, specifically marital status and dependents that can have an impact on their need.

Based on what we know about participants, this helps illustrate who may have a need so we can better educate them about the benefits of supplemental health with targeted communication.

View a sample page

Percent of employees not enrolled by gender

Percent of employees not enrolled by gender 78.4% of the 1,655 females are not enrolled. Whereas 73.8% of the 8,780 males are not enrolled. Female Male 0.0 % 1,298 of 1,655 0.0 % 6,476 of 8,780

Percent of employees not enrolled by marital status

Percent of employees not enrolled by marital status Of the 1,655 not enrolled, 70.6% are not married. 0.0 % 0 of 1,655

Percent of employees not enrolled with dependent children

Percent of employees not enrolled with dependent children 1,300 of the 1,918 not enrolled, have dependent children, which is 67.8% of employees. 0.0 % 1,300 of 1,918

Insurance gap demographics

Secure Insights groups employees with similar demographic characteristics into segments, creating a persona for each identified segment to help clients better understand the portions of their population with the largest gap.

This persona allows us to tailor product solutions, including plan maximums, that will better fit with the identified segments.

View a life insurance sample page

Existing resources gap Chart showing the average gap, between the average existing resources. Versus the average gap of $409,000. Existing resources Average$314K Averageneed$722K Average gap $409K

Plan design benchmarking

Secure Insights also provides plan design benchmarking. Competitive benefits help employers attract and retain talent. That's why seeing how their insurance plan compares to their peers' and the market is meaningful. Benchmarking data gives them confidence in their purchasing decision and helps inform plan design changes.

DOFU 1-2022

1994839